Tuesday, August 15, 2017

Homes Are Selling Quickly Nationwide


Homes Are Selling Quickly Nationwide

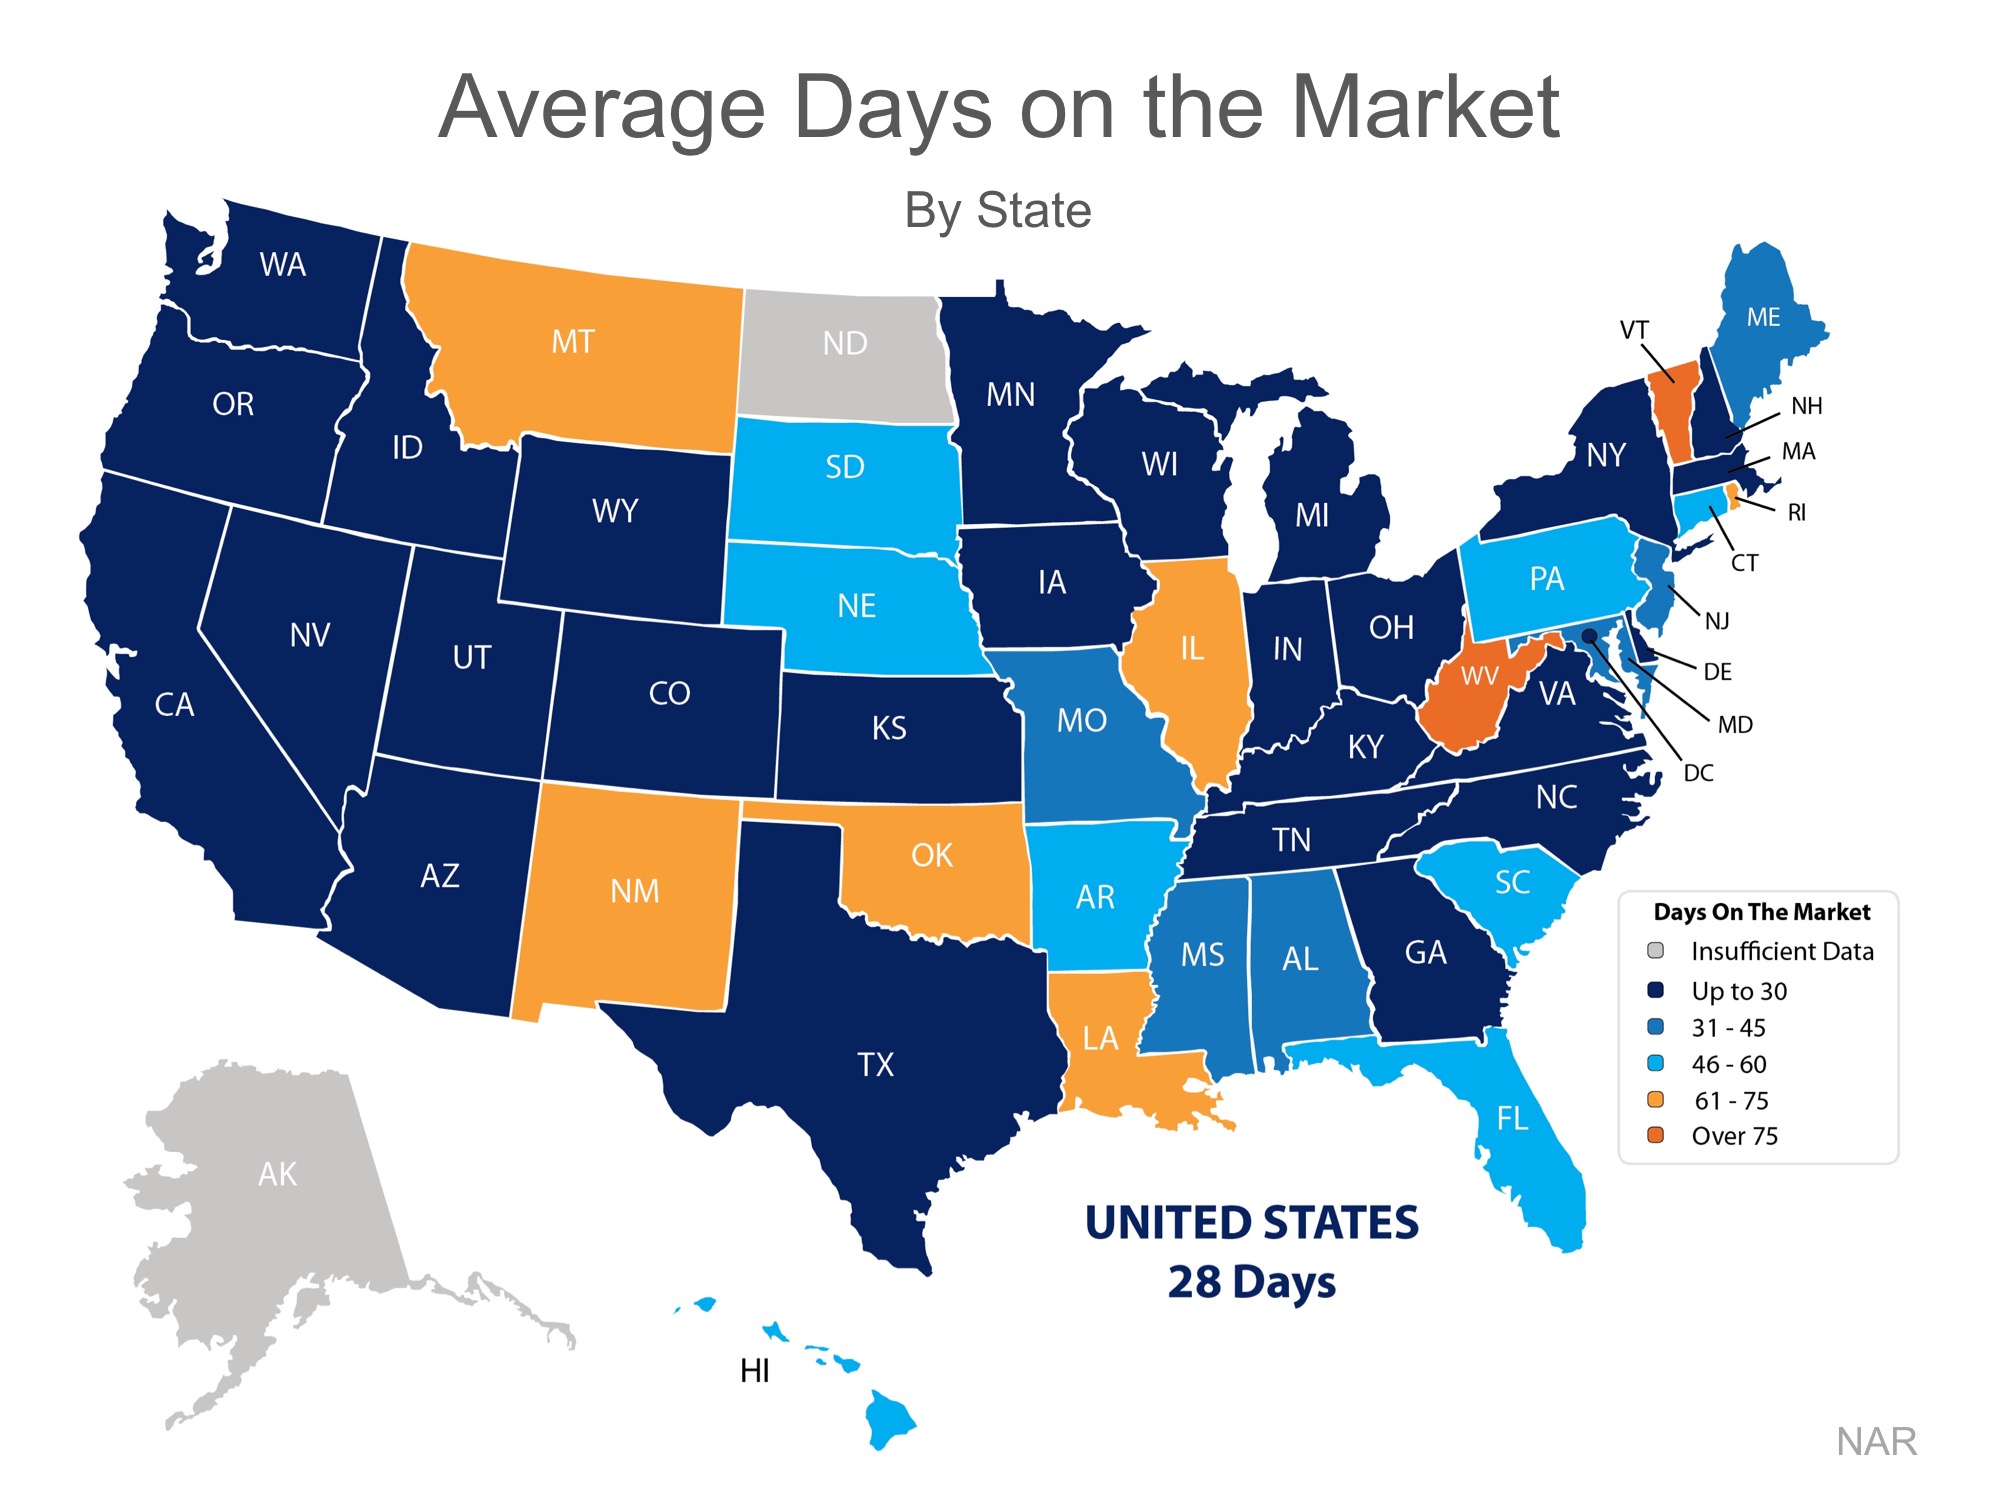
The National Association of Realtors (NAR) recently released their latest Existing Home Sales Report, which revealed that homes were on the market for an average of 28 days in June. This is a slight increase from the 27 days reported in May, but down from 34 days reported a year ago.

54% of homes across the country were on the market for less than a month in June!

Among the 27 states with homes selling in 30 days or less are Washington, Utah, California, and Colorado. The map below was created using results from NAR’s Monthly Realtors Confidence Index Survey.
Homes Are Selling Quickly Nationwide | MyKCM

Bottom Line

Buyer demand is increasing as the inventory of homes available for sale remains low. If you are thinking about listing your home for sale this year, let’s meet up so I can help you take advantage of current market conditions!


Call Me For All of Your Real Estate Needs!!


Debbie Mignogna, ABR, SRS
Your Blue Bell Realtor
BHHS Fox & Roach Realtors
267-640-1120


Your Opportunity to Achieve the American Dream Keeps Getting Better!

Your Opportunity to Achieve the American Dream Keeps Getting Better! | MyKCM
Forbes.com recently released the latest results of their American Dream Index, in which they measure “the prosperity of the middle class, and…examine which states best support the American Dream.”
The monthly index measures several different economic factors, including goods-producing employment, personal and commercial bankruptcies, building permits, startup activity, unemployment insurance claims, labor force participation, and layoffs.
The national index score was rounded out to 100.0 in January as a baseline for comparison and it rose the fourth straight month in a row to 101.8.
Alaska, coming in at 89.4, represented the lowest score on the index due in part to the recent collapse in oil prices. In contrast, Wyoming came in with the highest score at 115.1. The full results can be seen in the map below.
Your Opportunity to Achieve the American Dream Keeps Getting Better! | MyKCM
Forbes Senior Editor Kurt Badenhausen explained why many states saw a boost in the index last month:
“The American Dream Index rose for the fourth straight month to 101.8 propelled by gains in goods-producing jobs and building permits, as well as declines in unemployment claims and mass layoffs.
Goods-producing jobs (manufacturing, mining, construction and agriculture) were up for the ninth straight month in May…Building permits rose for the fourth straight month compared to the prior year.”

Bottom Line

The American Dream, for many, includes being able to own a home of one’s own. With the economy improving in many areas of the country, that dream can finally become a reality.


Call Me For All of Your Real Estate Needs!!


Debbie Mignogna, ABR, SRS
Your Blue Bell Realtor
BHHS Fox & Roach Realtors
267-640-1120


Which Homes Have Appreciated the Most?


Which Homes Have Appreciated the Most?

Home values have risen dramatically over the last twelve months. The latest Existing Home Sales Report from the National Association of Realtors puts the annual increase in the median existing-home price at 7.1%. CoreLogic, in their most recent Home Price Insights Report, reveals that national home prices have increased by 6.9% year-over-year.
The CoreLogic report broke down appreciation even further into four different price categories:
  1. Lower Priced Homes: priced at 75% or less of the median
  2. Low-to-Middle Priced Homes: priced between 75-100% of the median
  3. Middle-to-Moderate Priced Homes: priced between 100-125% of the median
  4. High Price Homes: priced greater than 125% of the median
Here is how each category did in 2016


Bottom Line

The lower priced homes (which are more in demand) appreciated at greater rates than the homes at the upper ends of the spectrum.

Call Me For All of Your Real Estate Needs!!


Debbie Mignogna, ABR, SRS
Your Blue Bell Realtor
BHHS Fox & Roach Realtors
267-640-1120


The Foreclosure Crisis: 10 Years Later


The Foreclosure Crisis: 10 Years Later


CoreLogic recently released a report entitled, United States Residential Foreclosure Crisis: 10 Years Later, in which they examined the years leading up to the crisis all the way through to present day.
With a peak in 2010 when nearly 1.2 million homes were foreclosed on, over 7.7 million families lost their homes throughout the entire foreclosure crisis.
Dr. Frank Nothaft, Chief Economist for CoreLogic, had this to say,
“The country experienced a wild ride in the mortgage market between 2008 and 2012, with the foreclosure peak occurring in 2010. As we look back over 10 years of the foreclosure crisis, we cannot ignore the connection between jobs and homeownership. A healthy economy is driven by jobs coupled with consumer confidence that usually leads to homeownership.”
Since the peak, foreclosures have been steadily on the decline by nearly 100,000 per year all the way through the end of 2016, as seen in the chart below.
If this trend continues, the country will be back to 2005 levels by the end of 2017.

Bottom Line

As the economy continues to improve, and employment numbers increase, the number of completed foreclosures should continue to decrease.


Call Me For All of Your Real Estate Needs!!


Debbie Mignogna, ABR, SRS
Your Blue Bell Realtor
BHHS Fox & Roach Realtors
267-640-1120


Housing Inventory Hits 30-Year Low


Inventory Hits 30-Year Low


Spring is traditionally the busiest season for real estate. Buyers, experiencing cabin fever all winter, emerge like flowers through the snow in search of their dream home. Homeowners, in preparation for the increased demand, are enticed to list their house for sale and move on to the home that will better fit their needs.
New data from CoreLogic shows that even though buyers came out in force, as predicted, homeowners did not make the jump to list their home in the second quarter of this year. Frank Nothaft, Chief Economist for CoreLogic had this to say,
“The growth in sales is slowing down, and this is not due to lack of affordability, but rather a lack of inventory. As of Q2 2017, the unsold inventory as a share of all households is 1.9 percent, which is the lowest Q2 reading in over 30 years.”
CoreLogic’s President & CEO, Frank Martell added,
“Home prices are marching ever higher, up almost 50 percent since the trough in March 2011.
While low mortgage rates are keeping the market affordable from a monthly payment perspective, affordability will likely become a much bigger challenge in the years ahead until the industry resolves the housing supply challenge.”
Overall inventory across the United States is down for the 25th consecutive month according to the latest report from the National Association of Realtors and now stands at a 4.3-month supply.

Real estate is local.

Market conditions in the starter and trade-up home markets are in line with the median US figures, but conditions in the luxury and premium markets are following an opposite path. Premium homes are staying on the market longer with ample inventory to suggest a buyer’s market.

Bottom Line

Buyers are out in force, and there has never been a better time to move-up to a premium or luxury home. If you are considering selling your starter or trade-up home and moving up this year, let’s get together to discuss the exact conditions in our area.


Call Me For All of Your Real Estate Needs!!


Debbie Mignogna, ABR, SRS
Your Blue Bell Realtor
BHHS Fox & Roach Realtors
267-640-1120